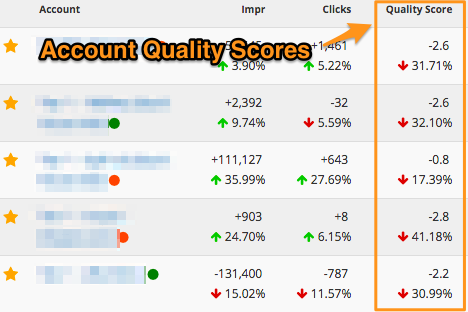
If you looked at your AdWords account earlier this week, you may have noticed some very dramatic declines in Quality Score. I noticed it myself as I logged into my Optmyzr MCC dashboard where we show the account level Quality Scores for all the accounts. Normally I’d see changes in the range of +/- 0.2 but this time the changes were all down around 2 points!

Of course, this got me very worried because clearly, Google had made some changes to the algorithm to cause this. Luckily it turns out that it was just a bug, so my QS was fine, it was just reported incorrectly. It’s at times like this though that I’m happy to have access to historical Quality Score through a tool like ours for a couple of reasons…
Reason #1: Verify the Quality Score bug has been corrected for your account
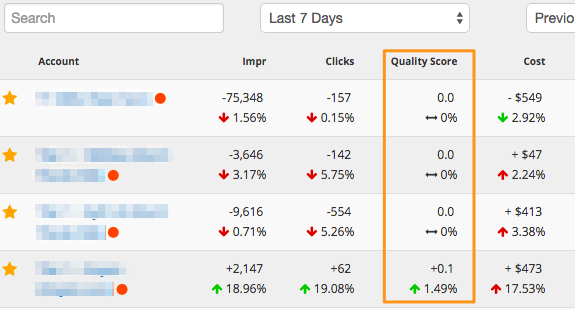
With Optmyzr’s Historical Quality Score Tracker, I can check if and when Google has fixed the Quality Score bug. Here you can see that by now my QS has returned to normal.

Reason #2: Find and fix the cause of quality score declines
If this had not been a bug, I could have used the QS Tracker to identify the elements of my account that were in the worst shape or that had dropped the most. In this example, the ad group “Navy Blue Sweaters” is recommended for optimization because even though it doesn’t have the worst QS in the account, it has the worst combination of spend and QS. Fixing this one would most likely raise QS for the entire account the most.

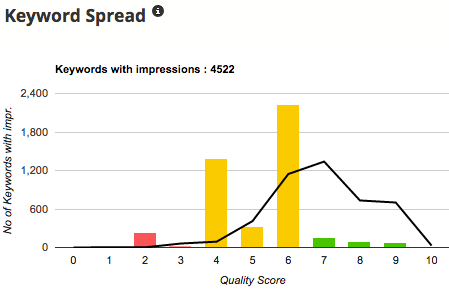
I could also get a sense of what type of QS change had taken place in the account with the chart that shows how many keywords exist at every QS level in my account. The graph shows both the number of keywords at each level for the start and end date of the selected date range.

You could argue that just looking at the number of keywords with a low QS doesn’t tell you much because only keywords with lots of impressions contribute meaningfully to the account QS… and you’d be correct! That’s why we also include a visualization showing how many impressions happened at each QS level, helping you hone in on the keywords that are most in need of a fix.

Update #1 – March 30, 2015
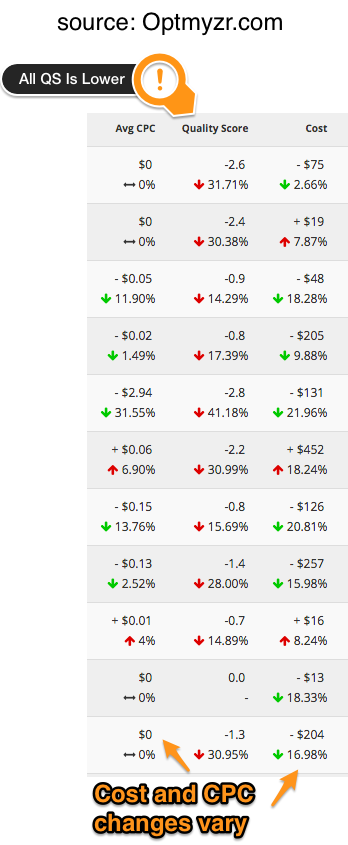
Advertisers report an increase in costs as a result of this bug. What I’ve seen in a handful of accounts I manage through Optmyzr is that there is no clear impact on CPC or cost. While all accounts seem to have been affected by the QS bug and have big QS drops, the costs and average CPCs are sometimes up, down, or unchanged.

 If you want to learn more about Quality Score, attend my full day AdWords workshop right before SMX Sydney. I’ll share everything I know and it’s a beautiful location for a conference!


