You don’t need superpowers to create PPC reports that look good and keep your clients happy.
But creating good PPC reports without help is no cakewalk. They’re time-consuming, tedious, and ineffective when done poorly.
The reality is that reporting often gets lower priority for busy PPC pros. And when client budgets get slashed or expectations rise, advertisers are put to the test delivering reports that provide a solid enough snapshot to keep clients happy.
Beyond that, PPC reports build better client relationships and promote agency expansion. For that, a static monthly PDF of tables and charts is no longer enough. Your reports need to inform as well as excite your clients and convince them to keep doing business with you.
What are the most important goals for a PPC report?
To determine your specific PPC reporting goals, it’s essential to ask yourself the fundamental question: “What does success look like for my account?” Defining your ultimate objectives provides a clear sense of direction for all your PPC reporting efforts.
For some businesses, success might revolve around demonstrating consistent improvements in overall ROI. This implies that their primary focus is on the financial performance of their campaigns.
Meanwhile, others may prioritize showcasing the progressive work they’ve done, emphasizing the tactics and strategies employed to achieve results. Additionally, high-level trends in the PPC data may be the focal point for businesses aiming to adapt and optimize their campaigns based on market dynamics.
Before creating your PPC report, it is crucial to establish clear and meaningful goals that will guide your reporting efforts.
The goals you set for your PPC reporting can vary significantly depending on your specific situation, whether you are managing a client’s account as an agency or an in-house team. Here is a breakdown of some key considerations and examples of PPC reporting goals:
1. Summarize key metrics clearly.
Use case: For high-level stakeholders who require a quick understanding of campaign performance without delving into granular details.
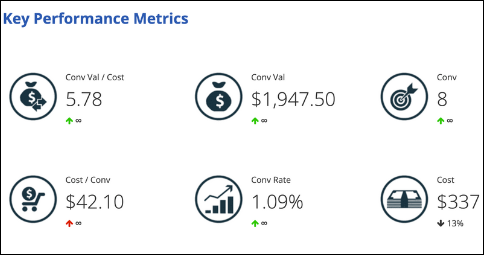
Screenshot from Optmyzr’s account report: overview of KPIs
If you want to get text explanations of changes that happened to your ads account across two different time periods, check out the PPC Narrator Widget.

Optmyzr’s PPC Narrator
The widget can either highlight the areas of improvement or let you know about the positive account changes.
2. Showcase how your efforts are delivering a positive ROI.
Use Case: For a business aiming to justify its advertising spend and ensure it is generating profitable results.
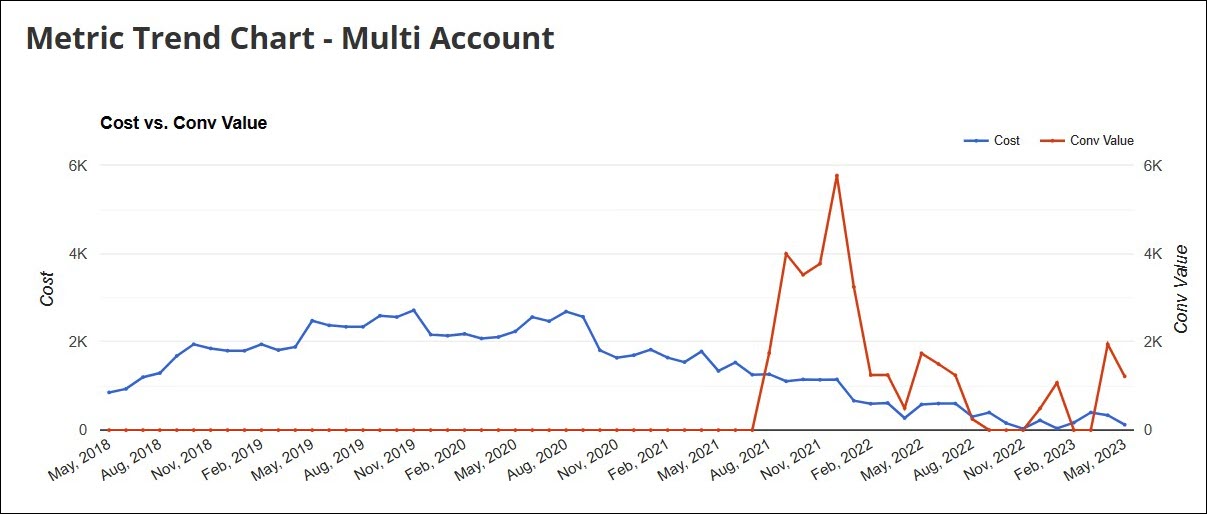
Screenshot from Optmyzr’s account report: Multi-account report trend chart
3. Highlight the value you bring to the PPC campaigns.
Use Case: For agencies seeking to impress clients and build trust by showcasing the impact of their expertise.
4. Monitor and evaluate PPC performance.
Use Case: For ongoing campaigns to ensure they are on track to meet objectives and identify areas for improvement.
To compare your campaign performance against other accounts in your industry vertical or across verticals, check out our PPC Vertical Benchmarks.
The tool lets you compare how key metrics like Average CPC, Conversion Rate, CPA, CTR, and ROAS for your account compare to others in your industry vertical.
5. Identify patterns and draw insights.
Use Case: For adapting PPC strategies based on changing market dynamics and consumer behavior.
Check out Optmyzr’s Sidekick: your AI-based PPC assistant. It’ll help you jumpstart your account analysis process by asking a few important questions on the Account Dashboard.
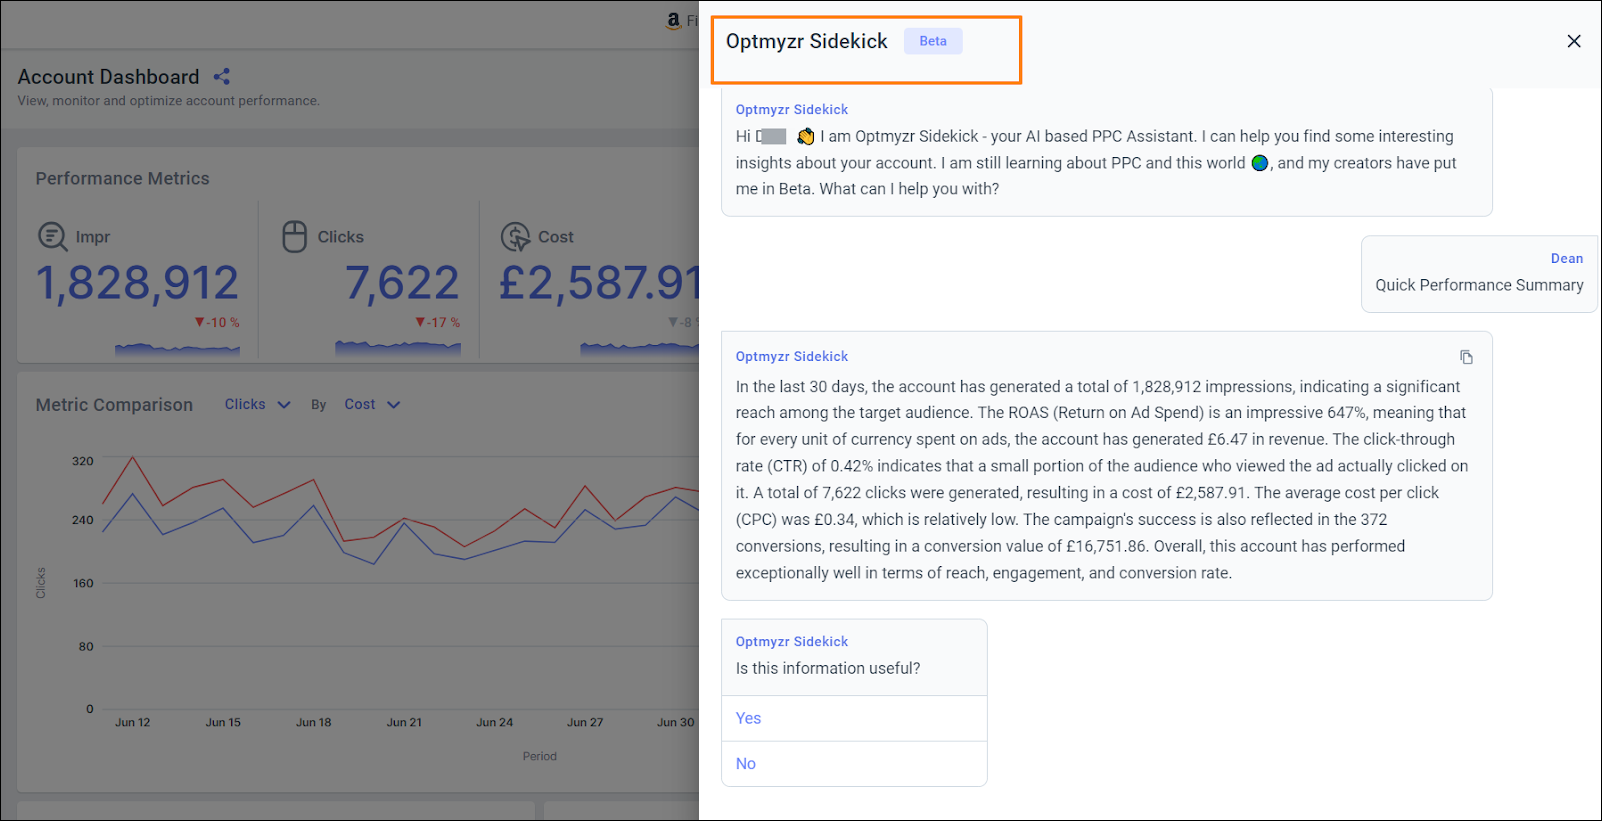
Optmyzr’s Sidekick: Your AI-based PPC assistant
You can quickly get useful insights into your account like a performance summary, month-on-month changes in key metrics, top optimization opportunities, etc.
How to build a great PPC report?
A good report begins with a high-level overview of account performance, works its way down to granular data that support your results, and should provide clear next steps.
Building a strong PPC report is a lot like telling a good story. Be truthful without embellishment, go into as much detail as possible, and make the account the hero. If you can nail this, your reports will provide great leverage when you have that discussion to extend or renew your contract.
Here are six tips to help you create great PPC reports.
1. Go beyond the numbers.
PPC reports are more than numbers on a page; they provide the right context to those numbers. After all, data in isolation is just noise. Pairing it with insights into your customers or how the numbers support business goals shows your clients that you understand them.
Rather than pulling all types of data together, first, understand what’s most important to your client. It’s good to revisit overall business objectives before building your next report to fine-tune what you should be reporting.
2. Pick metrics that matter to the business.
Once you have a clear understanding of what your client’s goals are, find out what parameters support these goals, and what a good result looks like. Treat your reports as a way to understand what you can do to take your accounts to the next level — better conversions, lower CPCs, more revenue, etc.
Reports can also highlight areas that need more attention, as well as showcase where the business is doing well. So be mindful of the metrics you pick.
Some of the most common metrics that advertisers use in their reports are:
- Return On Investment (ROI)
- Click-Through Rate (CTR)
- Cost Per Click (CPC)
- Conversion Rate
- Keyword Performance
- Customer Actions
3. Segment by intent.
If you focus just on conversions, you might make the account performance look poorer. After all, not all campaigns are about driving conversions.
Segment your report based on the different stages of the customer journey, according to intent or awareness. Not only does that tell you what works and when, but it can build credit for initiatives that help your lower-funnel campaigns convert.
Take this opportunity to experiment with different attribution models to understand which channels support different types of campaigns. This is an essential insight that can be the difference between simply regurgitating data and actually being a strategic asset to your client.
Watch this episode of PPC Town Hall on attribution modeling for ideas on how to approach attribution.
4. Look for truly helpful reporting tools.
Some PPC advertisers still use Google Sheets or Microsoft Excel to create their weekly and monthly reports. While there’s nothing wrong with the classics, they are time-consuming and can get frustrating if you’re not a data geek or have to work with really large data sets.
This is where the magic of automation truly shines. There are plenty of reporting tools that can save you time and produce outstanding reports, many with pre-built templates to make your job even easier. While Google Analytics and Looker Studio remain favorites, many PPC pros turn to advanced tools for more automated and integrated reports.
Optmyzr also does reports quite well, if we say so. You can build new templates or customize one of ours, including widgets for virtually any metric and level you need to show, and automate delivery to your client’s inbox. They’ll get a link to an interactive report rather than a static PDF, allowing them to hover over charts and data to get deeper insights.
5. Include visuals.
Steve Hammer, president at RankHammer, said about the importance of data visualization in PPC reports:
“I like to assume that I have 2 minutes of somebody’s time when I’m showing a PPC report. I like to present everything in a one-pager and make it as simple as possible.”
Visuals help your clients understand data faster and in a simpler format. Crucial information on performance, successes, and failures is easier to process visually. This is the key to showcasing more information in less space, while still making it easy to consume at a glance.
But the ocean of data visualization is vast and deep, so make sure to find out what formats your clients respond to best. They may have a preference for line graphs when all you’ve been serving is pie.
If you want to get detailed insights visually and find exactly which element in your account caused a metric to increase or decrease, whether it’s a keyword, placement, or an entire network that caused the changes, take a look at Optmyzr’s PPC Investigator.
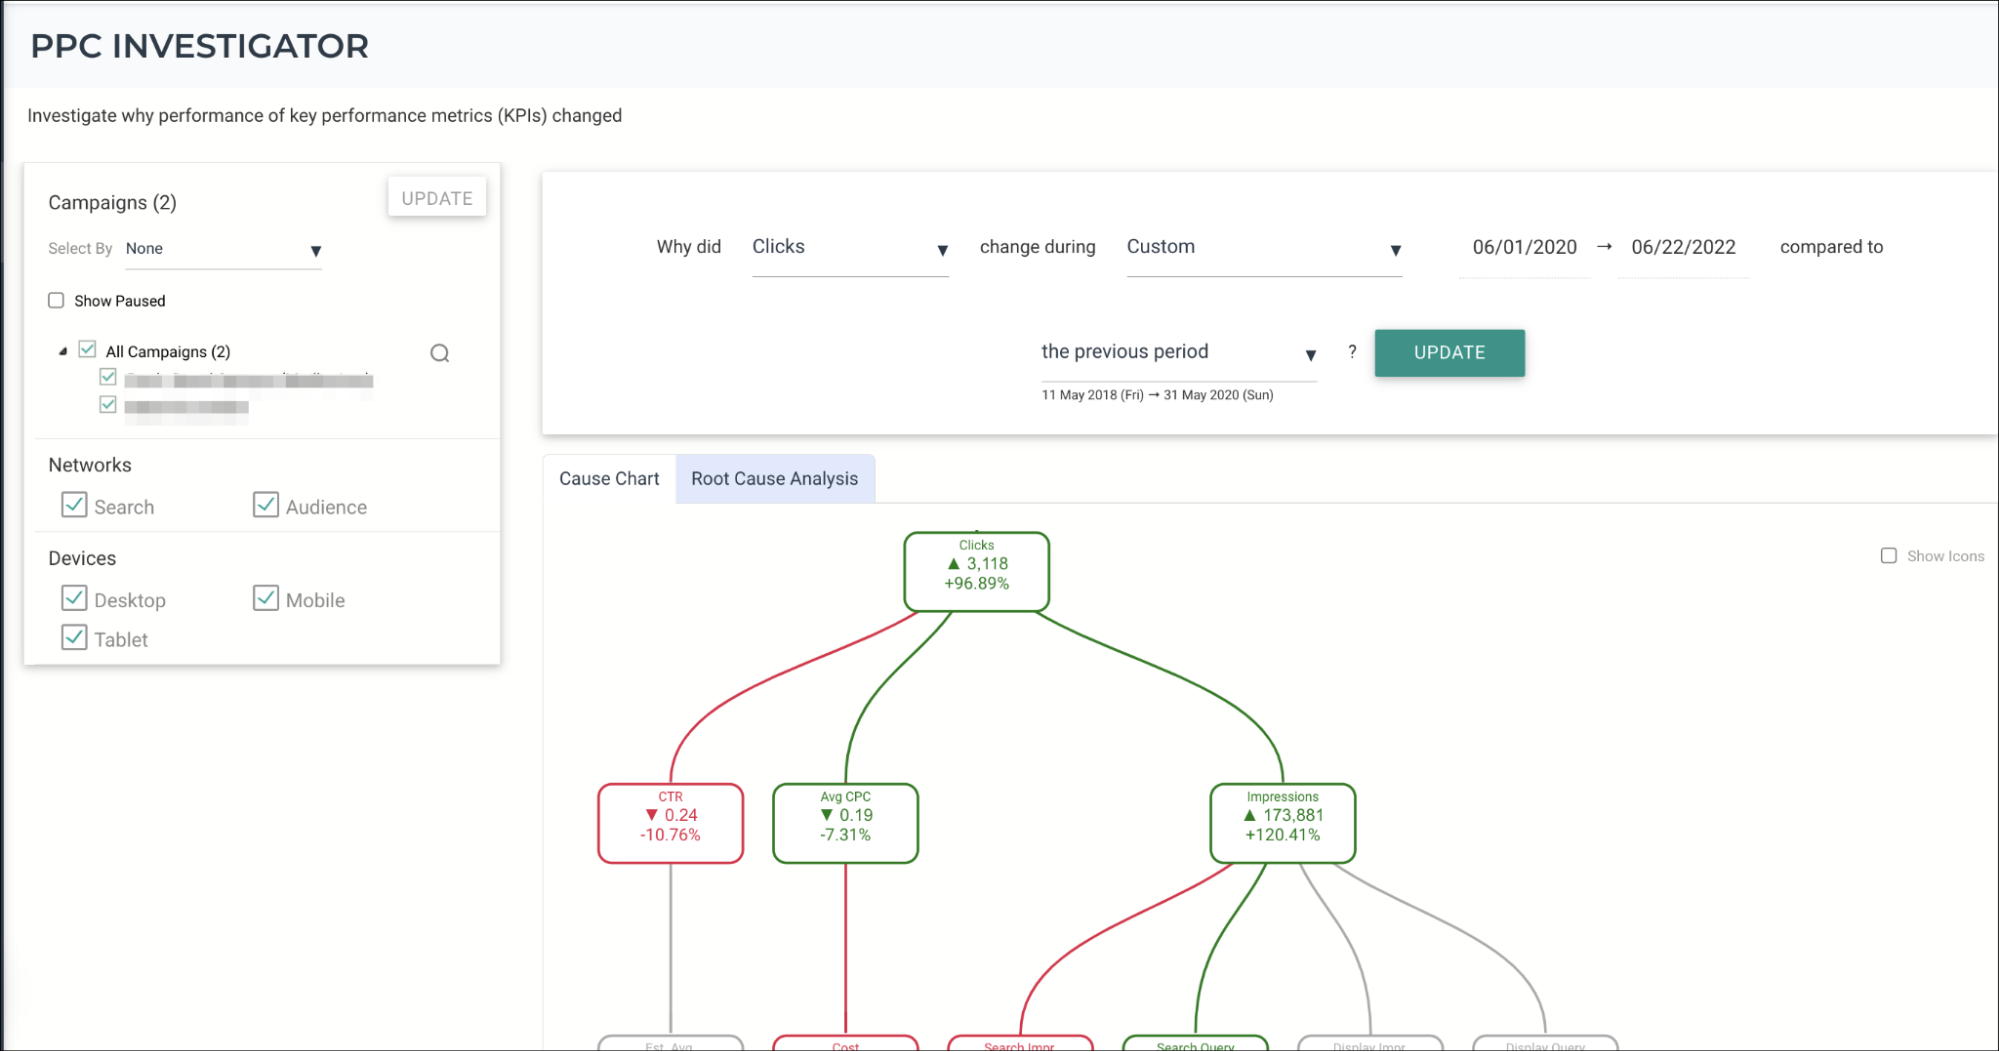
Investigate why performance of key metrics changed using PPC Investigator
6. Add your own insights and recommendations.
You don’t need an advertising or analytical mind to pull data and create reports from a template. It’s making sense of that data and helping clients understand the lay of the land that makes you a valuable partner to them.
Draw on your experience with similar accounts and campaigns to add your own insights to those reports. Explain how the numbers correlate with business goals, where you’ve seen good things go bad (like complacency), and what you think should be the next course of action.
But be fully transparent and tell the entire story. Some advertisers compensate for sliding numbers by exaggerating good results to keep clients in their favor. Give your clients the truth, the whole truth, and nothing but the truth. And then get ready to answer questions and discuss their suggestions.
Google Analytics 4 reporting made simple for PPC
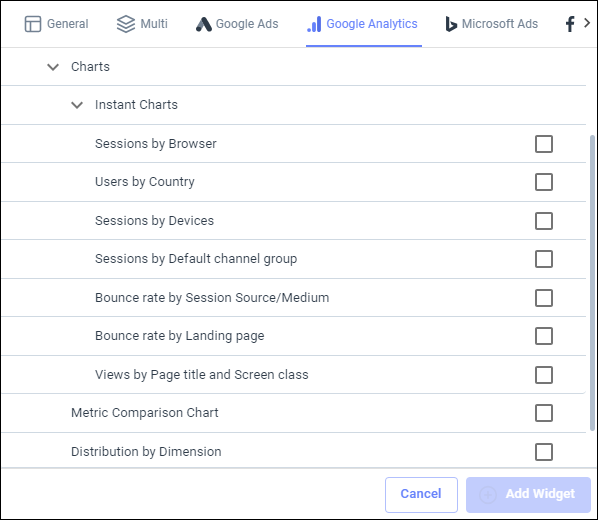
1. Report on any valid combination of dimensions or metrics conveniently.
Google presents the dashboards as themes on GA4. So it could be difficult to navigate and find reports that you want to check.
Optmyzr’s GA4 reporting tools have all the dimensions and metrics available together for you to choose from and easily report your account performance.
2. Identify trends and patterns in detail.
The charts can also help you understand trends and patterns, and compare KPI changes across time periods.
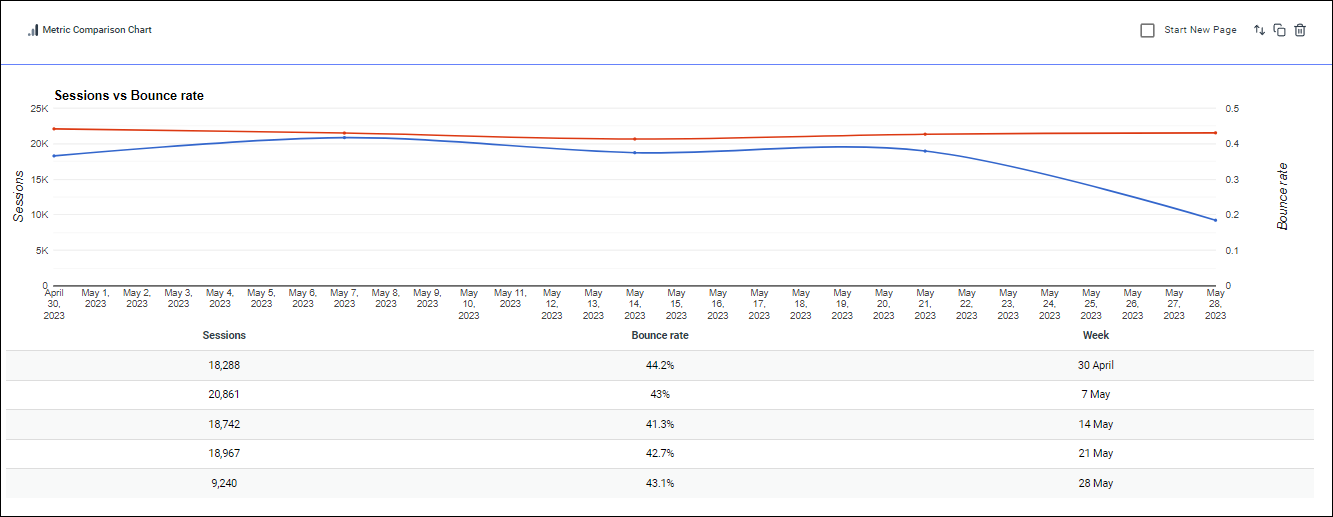
Plus, you can easily analyze the type of audience that you’re attracting, their demographics, and locations they come from.
3. Get a quick overview of metrics that matter to you.
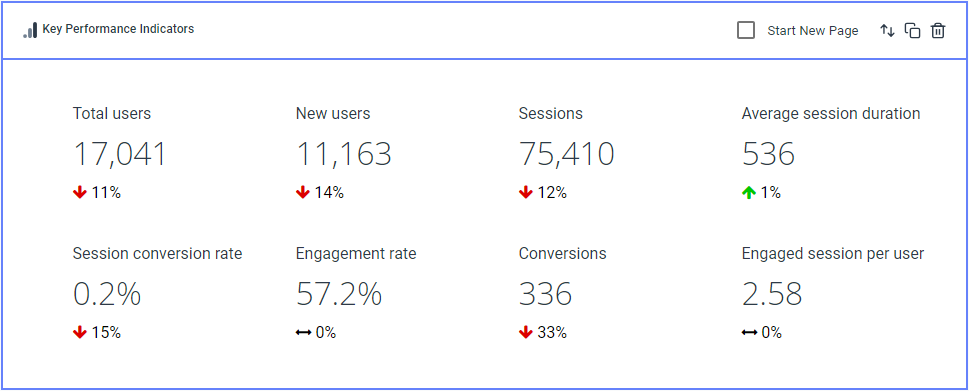
The KPI widget gives a clear representation of metrics that matter to your business along with performance changes at the property level.
4. Present all your PPC and other marketing data together in one report.
With multi-account reports, you can track analytics performance along with that of all the different ad platforms like Google, Microsoft, Meta and Amazon where you’re running your campaigns all in a single report. This can help you relate your PPC KPIs with analytics KPIs and measure the overall impact of your ad campaigns on site traffic.
If you’re an existing Optmyzr user and want to migrate your reports from UA to GA4, follow this guide.
6 Common PPC reporting mistakes to avoid
Our Co-founder & CEO, Frederick Vallaeys listed down 6 reporting mistakes PPC marketers make in this article.
Here’s a TL;DR.
1. Reports sent too soon that always undervalue PPC.
2. Your visuals tell the wrong story.
3. Improperly segmented reports are useless.
4. Too much data + PPC newbie = disaster.
5. Don’t take it personally when your report is ignored.
6. When you spend too much time on reports, your account management hours suffer.
Great PPC reporting provides context and analysis
The best PPC reporting strives to provide context and analysis, delve into the reasons behind wins or losses, and incorporate current trends and industry best practices. Ultimately, a great PPC report serves as a source of meaningful data and insights, empowering stakeholders to make informed decisions and optimizing the overall effectiveness of PPC campaigns.
By leveraging the right reporting tool, you can create PPC reports that not only inform but also satisfy your clients, fostering trust and confidence in your services. And if you need help, Optmyzr makes it easier to showcase the value of your campaigns.
Not an Optmyzr customer yet? Thousands of advertisers — from small agencies to big brands — around the world use Optmyzr to manage over $4 billion in ad spend every year.
Sign up for our 14-day free trial today to give Optmyzr a try. You will also get the resources you need to get started and more. Our team will also be on hand to answer questions and provide any support we can.


