The Quality Score Tracker is one of our most popular tools and we’ve just given it a makeover! We’ve added several new capabilities that we’re sure you’ll love.
See historical QS at a glance
We improved how we show historical QS by including the data for the first and last date of the selected date range on all views. We now also include the highest and lowest QS values from the selected period, giving you a better understanding of how your current QS compares with historical data.
Find areas of opportunity
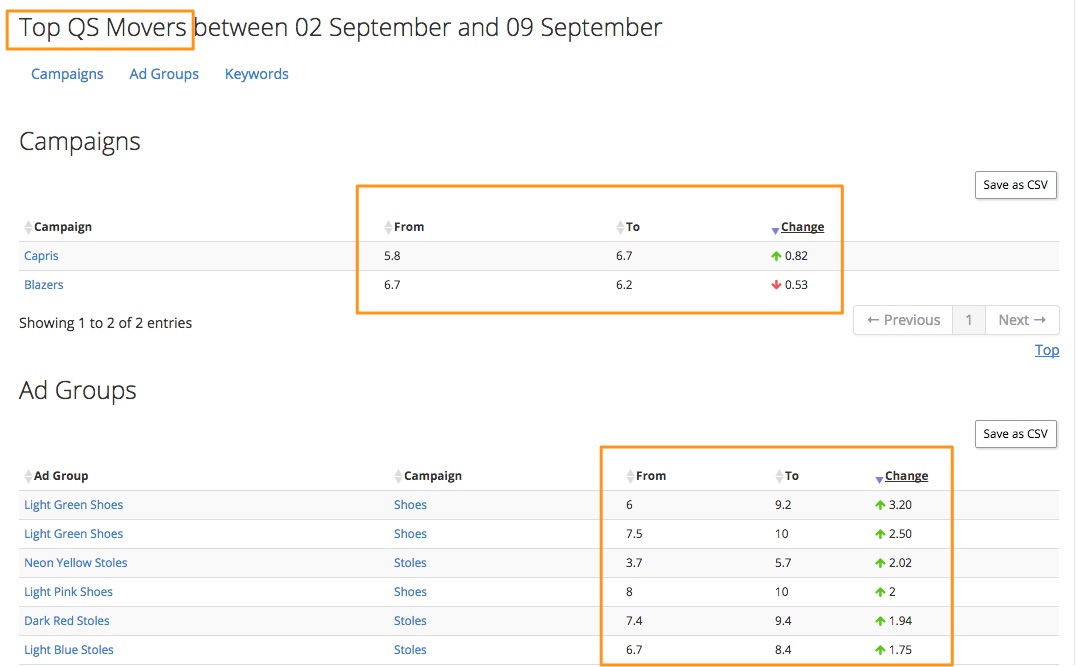
Our new Top Movers table shows the campaigns, ad groups, and keywords that saw the most significant change in Quality Score for the selected date range. This makes it easier to find items whose QS has slowly declined and needs to be fixed. It also shows items whose QS has improved which may provide insights about the types of optimizations that are delivering results.
Find ad texts to fix
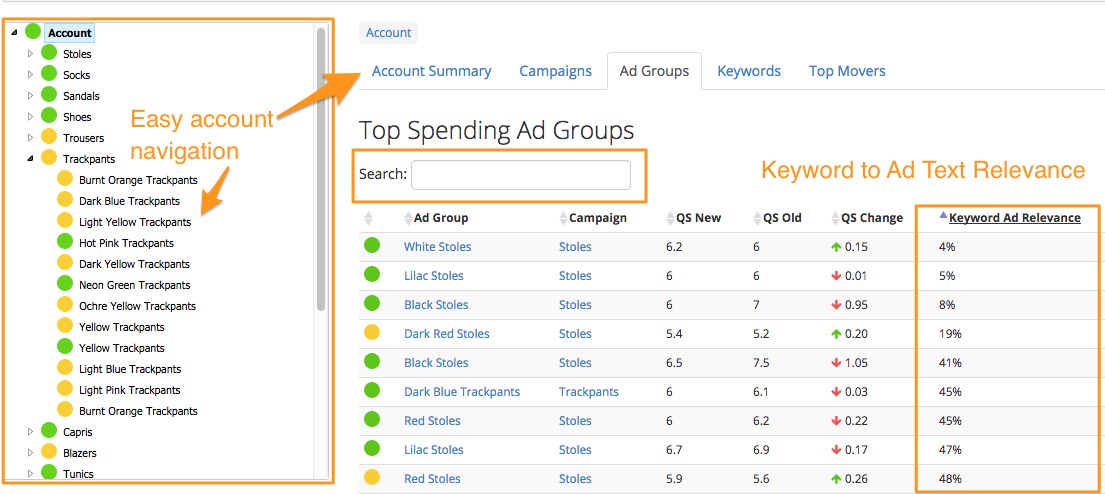
We added the Keyword Ad Relevance subcomponent of QS to keywords and also aggregated it at the account, campaign, and ad group levels. This makes it easy to find instances where you can improve QS by improving the ad text using tools like our AB Ad Testing tool or the Ad Template Report Enhanced Script.
See only the data you need
We added a text search box so that you can quickly hone in on just the keywords, ad groups, and campaigns that contain specific text.
A big change that we made to the Quality Score Tracker was that we now include impressions from all devices (mobile, desktops, tablets) on Google search to calculate the weighted impression share. Earlier, we were only using impression data from desktops on Google search. If you’re getting a lot of traffic from mobile, you’ll may notice a change in the account, campaign and ad group level Quality Scores.


